


A Unified Dashboard for Comprehensive Revenue Analysis
The Revenue Insights Hub provides an all-in-one view of your publisher earnings, allowing you to explore performance from every angle. With visual breakdowns and flexible filters, it’s easier than ever to uncover insights, spot gaps, and maximise your earning potential.
Key Features of the Revenue Insights Hub
1. Overview Tab: Your Revenue at a Glance
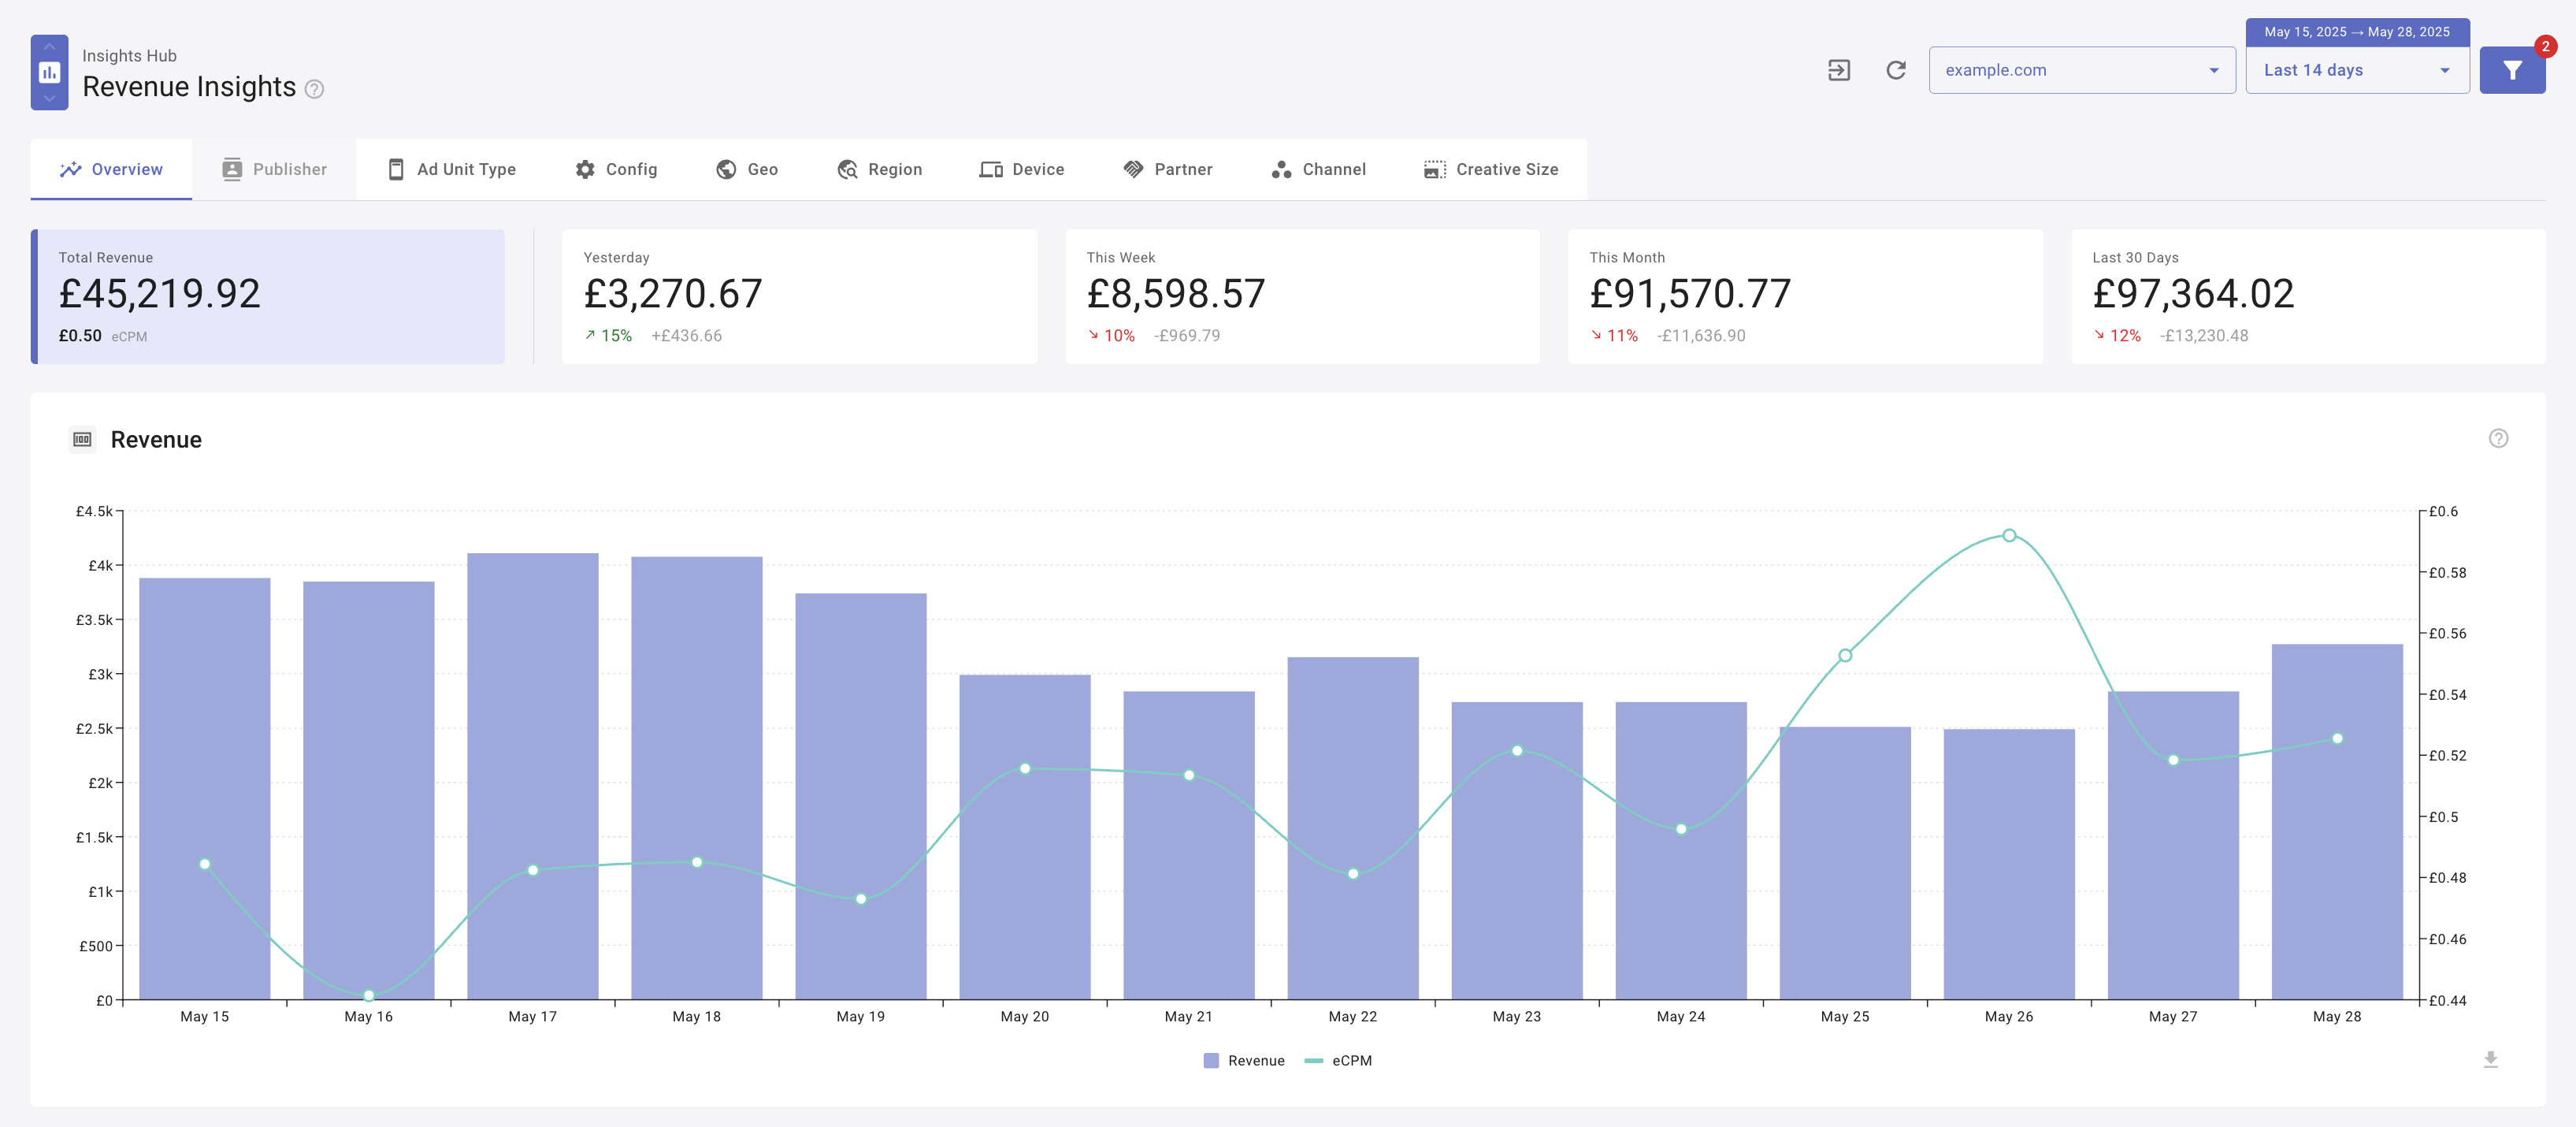
The Overview tab consolidates total revenue data into a single view. You’ll see top-level stats showing overall revenue, plus fixed-period comparison figures to give you a broader picture of how things are trending. A revenue chart breaks this down further, showing date trends for a deeper look into revenue performance over the selected date range. Finally, there’s a fully exportable table that brings together a range of metrics – giving you the tools to filter, sort, and analyse the data however suits you best.
2. Dimension Views: Deep Dive into Revenue Sources
Each dimension view lets you break things down even further, showing exactly where your revenue is coming from. These views pull out the top ten performers (by gross revenue) in each dimension category, highlighting both the best and worst performers so you can spot any weak areas and make smart, data-backed decisions to optimise your setup. The graphs show revenue and eCPM by day, so you get a full picture of how things stack up over time – and you’ll still have access to the same exportable data table for deeper analysis across all dimensions.
3. Advanced Filtering Options: Tailored Data Analysis
As with other Insights Hub pages, the global filters for Publisher and Date will shape the data you see. On top of that, you’ll find a few extra filters on this page to help narrow things down even more.
- Dimension Filter: When you’re viewing a specific dimension tab, you’ll get a Dimension Filter dropdown to help you drill down into the data. This lets you focus on a specific dimension value, such as a particular device or country, to see how it’s performing over time.
- Further Fine-tuning: Additional filters allow you to refine your analysis even more, enabling you to uncover specific insights and trends that can inform your monetisation strategies.
4. Exportable Data: Seamless Reporting and Sharing
All tables within the Revenue Insights Hub are fully exportable, giving you full control to manipulate, share, and incorporate your revenue data into wider business reporting. This feature ensures that your team can collaborate effectively, making data-driven decisions with ease.
Benefits of Using the Revenue Insights Hub
- Holistic Revenue Analysis: Gain a comprehensive understanding of your earnings, identifying both strengths and areas for improvement.
- Informed Decision-Making: Leverage detailed insights to make strategic decisions that enhance your monetisation efforts.
- Efficiency and Control: Streamline your revenue analysis processes, saving time and resources while maintaining full control over your data.
- Enhanced Collaboration: With exportable data and intuitive visualisations, your team can work together more effectively to drive revenue growth.
Getting Started with the Revenue Insights Hub
Integrating the Revenue Insights Hub into your publishing operations is straightforward. Content Ignite provides comprehensive support to ensure a smooth setup process. Once integrated, you’ll have immediate access to a wealth of data and insights to inform your monetisation strategies.